
Bank Reconciliation Windows Enhancements
| Charts and Graphs | |||||
 |
|||||
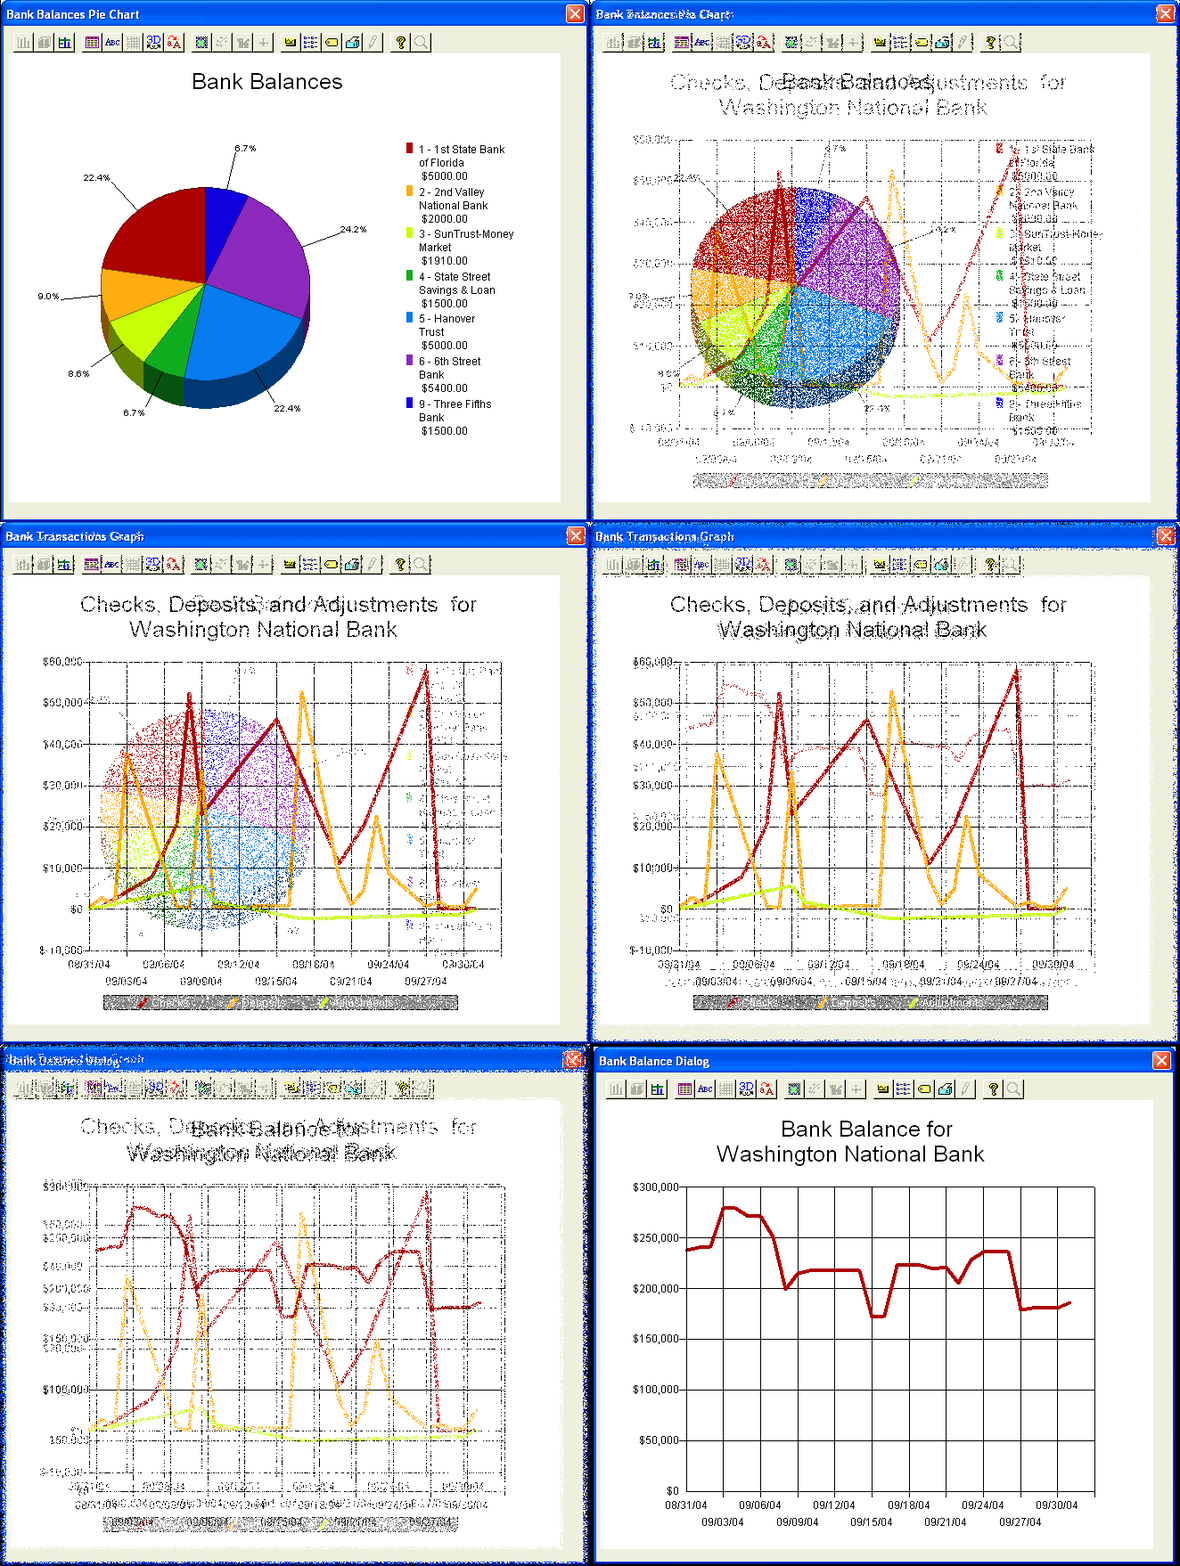
| Thought we were running out of great new features to tell you about? Nope, we saved one of the best for last! Bank Reconciliation has a brand new program called Charts and Graphs, and it'll knock your eyes out! Reports are important, but to really track your business there's simply no substitute for seeing things in a graphic. Graphs and charts were impossible in our character-based DOS product, but in Windows we can finally break those bonds and offer you a robust and flexible graphing package. Shown above are the three graphs that come standard with Bank Reconciliation. You have a pie chart showing comparative bank balances for all your banks, a graph showing all check, deposit and adjustment activity over time, and a chart showing your bank balance over time. Now these basic charts are great, but if you take a look at the top of the dialog you'll see a row of buttons - those buttons represent a huge array of options that allow you to customize everything about the look and feel of these graphs. You can format your data in practically any way imaginable, from variations on the basics we provide, to entirely different types of graphs, like polar coordinate charts, 3-D surface graphs, bubble charts, and Gantt charts. And of course they can all be printed in glorious full color on your color printer. But a word of warning. Once you start playing with all the settings and options, you may find that you get addicted! |
|||||
Roundtable Software Home | Add-On Products | Custom Programming | Support Services | Power Utilities | What's New | Site Map
|
|
||||
 |
||||
| Roundtable Software • 30831 Cove Road • Tavares, FL 32778-5164 (352) 253-9779 • FAX: (815) 572-5446 All contents copyright © 2000-2008 Roundtable Software. All rights reserved. |
||||